
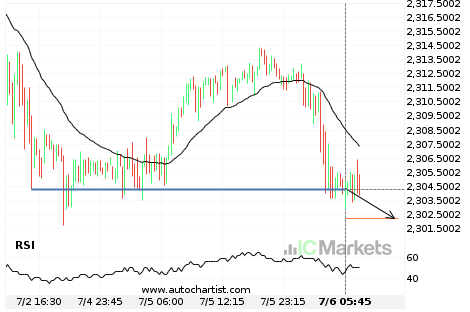
US Small Cap 2000 Index – psychological price line breached
US Small Cap 2000 Index has broken through the support line of a Support. Because we have seen it retrace from this position in the past, one should wait for confirmation of the breakout before trading. It has touched this line numerous times in the last 4 days and suggests a target line to be […]
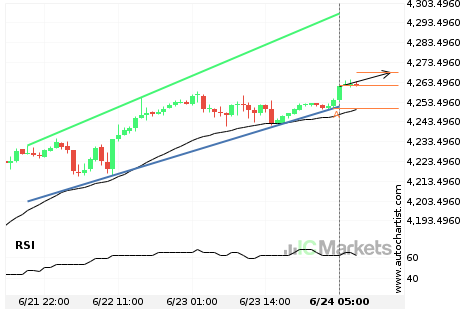
US Tech 100 Index approaching support of a Channel Up
US Tech 100 Index is approaching the support line of a Channel Up. It has touched this line numerous times in the last 10 days. If it tests this line again, it should do so in the next 2 days.
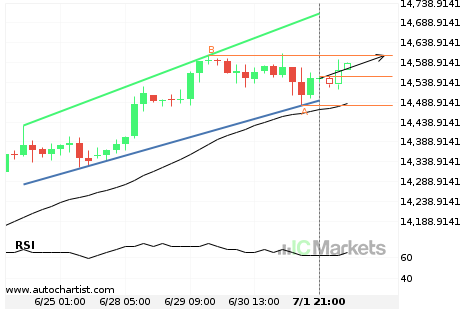
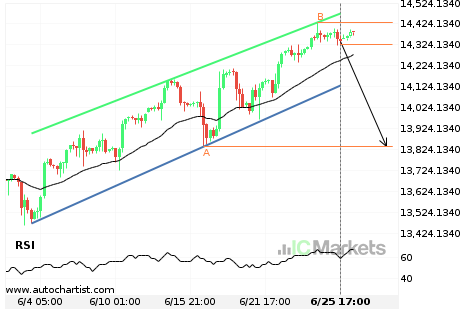
US Tech 100 Index approaching resistance of a Channel Up
US Tech 100 Index is approaching the resistance line of a Channel Up. It has touched this line numerous times in the last 8 days. If it tests this line again, it should do so in the next 2 days.
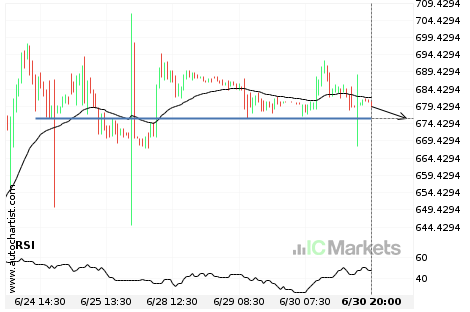
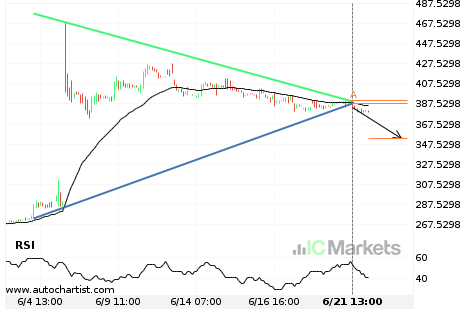
Tesla Motors Inc. approaching important 675.8900 price line
Tesla Motors Inc. is approaching the support line of a Support. It has touched this line numerous times in the last 7 days. If it tests this line again, it should do so in the next 23 hours.

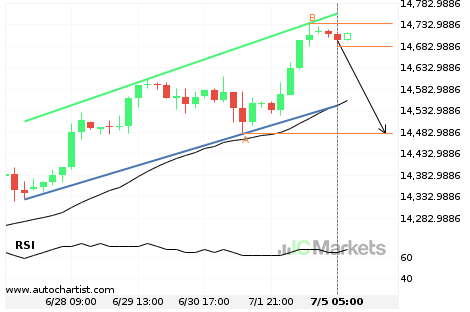
Will Netflix Inc. have enough momentum to break support?
Netflix Inc. is heading towards the support line of a Rising Wedge and could reach this point within the next 7 hours. It has tested this line numerous times in the past, and this time could be no different from the past, ending in a rebound instead of a breakout. If the breakout doesn’t happen, […]
US Tech 100 Index approaching support of a Channel Up
US Tech 100 Index is approaching the support line of a Channel Up. It has touched this line numerous times in the last 23 days. If it tests this line again, it should do so in the next 3 days.
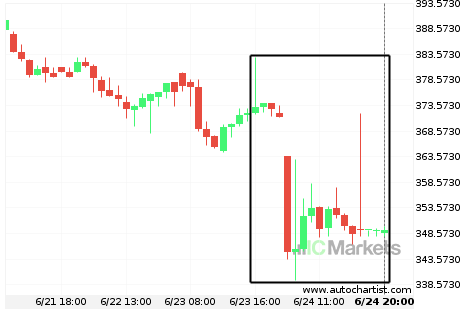
Biogen Idec Inc experienced an exceptionally large movement
For those of you that don’t believe in trends, this may be an opportunity to take advantage of an exceptional 6.61% move on Biogen Idec Inc. The movement has happened over the last 2 days. For those trend followers among you, you may think about riding this trend.
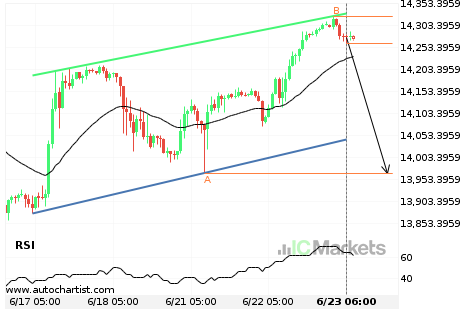
Should we expect a breakout or a rebound on US SPX 500 Index?
The movement of US SPX 500 Index towards the resistance line of a Channel Up is yet another test of the line it reached numerous times in the past. We expect this line test to happen in the next 15 hours, but it is uncertain whether it will result in a breakout through this line, […]
US Tech 100 Index approaching support of a Channel Up
US Tech 100 Index is approaching the support line of a Channel Up. It has touched this line numerous times in the last 7 days. If it tests this line again, it should do so in the next 2 days.
Biogen Idec Inc – support line breached
Biogen Idec Inc has broken through the support line of a Triangle technical chart pattern. Because we have seen it retrace from this position in the past, one should wait for confirmation of the breakout before trading. It has touched this line twice in the last 18 days and suggests a target line to be […]